|
Sensor Specifications
|
Item
|
Data
|
||||||
|
Natural Frequency
|
Power
|
5Hz
|
||||||
|
Frequency Bandwidth
|
0.2Hz~200Hz
|
|||||||
|
Sensitivity
|
Bucket capacity
|
190 V/m/s
|
||||||
|
Frequency Response
|
Operating weight
|
0.1~1600Hz
|
||||||
|
Distortion
|
<0.1% @12Hz, (0° ~ 10°) tilt,(0°~3°) horizontal tilt
|
|||||||
|
Physical Indicators
|
Item
|
Data
|
||||||
|
Size
|
Power
|
Φ129.3mm,H211.5 mm
|
||||||
|
Weight
|
Bucket capacity
|
<2.2kg(with battery without cone)
|
||||||
|
Waterproof
|
IP67
|
|||||||
|
Operation Temperature
|
Operating weight
|
-40℃~85℃
|
||||||
|
Self-noise Level
|
Whole frequency band lower than the NHNM curve,5s~1Hz lower than the NLNM curve
|
|||||||

|
Electronics Indicators
|
Item
|
Data
|
||||||
|
Channels
|
Power
|
3-Channels (built-in three-component sensor)
|
||||||
|
Endurance
|
Built in battery, typical working conditions, with a range of 20 days (4G transmission mode). External battery can achieve
year-round non-stop and ultra long battery life |
|||||||
|
Synchronization Accuracy
|
≤1 µs(After GPS signal lock)
|
|||||||
|
AD Converter
|
32Bit ADC
|
|||||||
|
Preamplifier Gain
|
0dB,6dB,12dB,18dB,24dB,30dB,36dB
|
|||||||
|
Sampling Interval
|
4ms,2ms,1ms,0.5ms,0.25ms
|
|||||||
|
Maximum Input
|
5 V
|
|||||||
|
Dynamic Range
|
123dB(1ms Sampling Interval,0dB Preamplifier Gain)
|
|||||||
|
Noise Level
|
0.11μV RMS(1ms Sampling Interval,36dB Preamplifier Gain)
|
|||||||
|
Common-mode Rejection
|
Bucket capacity
|
>110dB(1ms Sampling Interval,0dB Preamplifier Gain)
|
||||||
|
Harmonic Distortion
|
Operating weight
|
<-122dB(1ms Sampling Interval,0dB Preamplifier Gain)
|
||||||


|
Charging and Data Recovery Cabinet
|
Item
|
Data
|
||||||
|
Number of Channels
|
Power
|
6 Channels(Charging and data recovery at same time)
|
||||||
|
Weight
|
4.7 kg
|
|||||||
|
Size
|
360mm*280mm*180mm
|
|||||||
|
Data Transmission Interface
|
RJ45 Ethernet
|
|||||||
|
Charging Current
|
Single Channel Max 4A, 16 Channels Max 58A
|
|||||||
|
Input Power
|
220V/110V AC, Max Current 5A, Max Power 1100W
|
|||||||
Practical Application for UGL-3C:
1.Engineering exploration:
Urban underground space, roadbed boulders, urban drainage pipelines, detection of engineering crack.
Foundation or subgrade survey for hollowing Division of rock formation and cover layer Rock formation division and disease
Geological body survey Research on the embedded depth, shape and distribution rule of the basal layer
Lithology mutation (aquifer), coal and oil and gas exploration, etc.
Karst, fault fracture zone, collapse column, goaf, real-time monitoring of overburden thickness.
Long term real-time monitoring of various micro seismic events;
Real time monitoring and warning of geological disasters, landslides, collapses, etc;
Research on real-time monitoring of micro earthquakes and real-time imaging of background noise
in universities and research institutes.
Monitoring of crustal and upper mantle plate activity.
exploration, scientific research and seismological research.


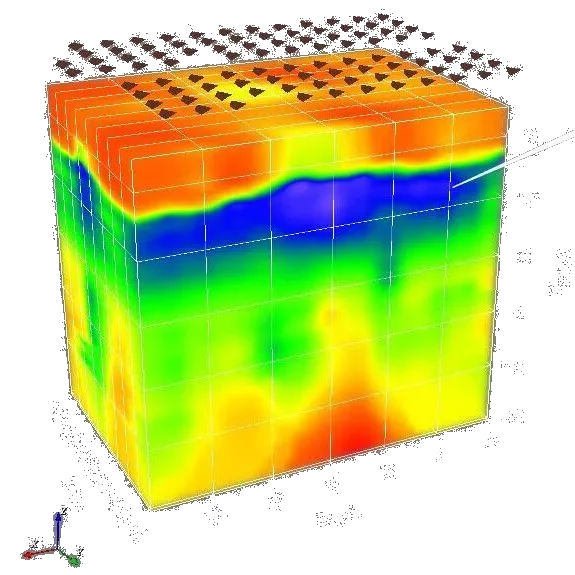
1. Real time monitoring based on 4G/5G, real-time intelligent processing and generation of velocity profiles 2. Ultra low power consumption, same battery, longer field acquisition time 3. Standard industrial design, production, and inspection testing 4. Full series without physical switches, lightweight and durable, with higher reliability in the wild 5. Abnormal displacement, vibration, intelligent alarm and anti-theft


Micro motion H/V spectral ratio refers to the ratio of the horizontal and vertical components of seismic background noise at different frequencies recorded on the surface. In the field of engineering seismology, V is usually used to represent the vertical component of micro motion records, and H is used to represent the horizontal component of micro motion records. After measuring the H/V spectral ratio curve as a frequency function, based on a certain relationship (usually empirical), the relationship between the peak value of the H/V spectral ratio curve and the fundamental resonance frequency of the geological structure is established to estimate the thickness of sedimentary layers or site amplification factor, sometimes also known as the HVSR (Horizontal to Vertical Spectral Ratio) or QTS (Massi Transfer Spectrum) method


Reviews
There are no reviews yet.